Traffic study offers insight into accidents and the city’s population
The latest study on traffic patterns and accidents was recently released by SEMCOG. You can find out all sorts of interesting information at the organization’s website.
By Alan Madlane
The stats from SEMCOG are out about Southeast Michigan’s driving habits from last year, and the news is a mixed bag.
SEMCOG is the Southeast Michigan Council of Governments, a group that partners with the area’s local governments to share statistics, help shape policies, and advocate for the region to Lansing and Washington D.C.
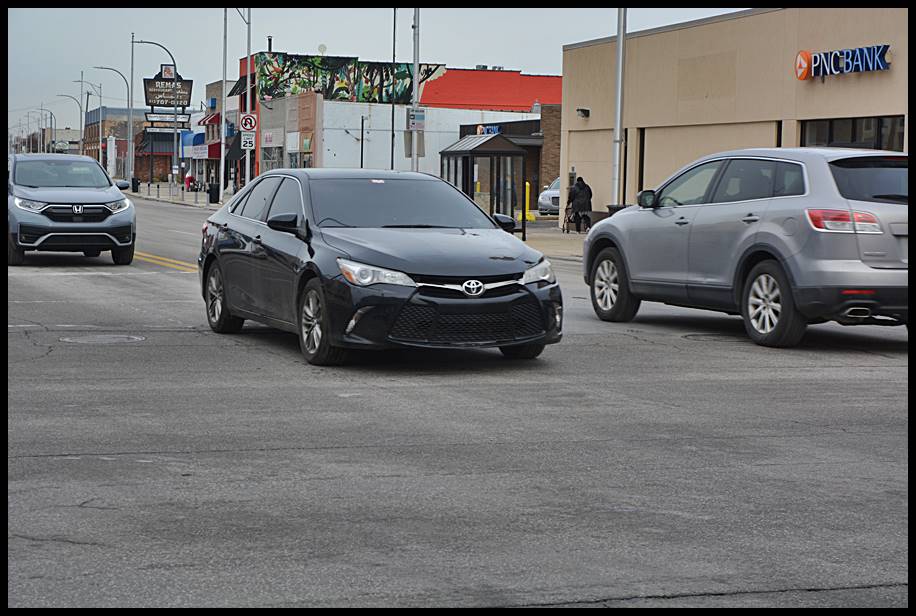
Per SEMCOG, there were fewer crashes in the metro area – but they were more often fatal.
That would seem to support what might be expected for the first year of the pandemic, which saw roadways far less congested, a fact that then persuaded some drivers they could fly like they were at Michigan International Speedway.
Another factor that came into play was likely the reduced police presences on the roadways during that time.
The latest data arise from a newsletter published by the organization on Oct. 28 of this year.
This updated data shows a 25 percent decrease in total crashes for the seven-county area of Livingston, Macomb, Monroe, Oakland, St. Clair, Washtenaw and Wayne, as versus 2019. The number of crashes, which was not explicitly given, was said to be the lowest in a decade.
Fatalities, conversely, reached a decade high of 452, an increase of 24 percent over the prior year.
Human error, at times compounded by alcohol use, drug use, and/or distractions like texting while driving, is a contributing factor in a whopping 94 percent of automobile accidents, according to the agency.
SEMCOG recently completed their “Walk.Bike.Drive.Safe Campaign,” a regional campaign to remind everyone about road-related safety. While the tips are far too numerous to recount here, they can be found on the agency’s website by putting that phrase into their main search window.
The site proves extremely useful for breaking down stats by county or city within the Southeast Michigan region.
Clicking on the link to Hamtramck, one can then access, via the green MENU drop-down menu on the left side of the city’s page, the Data and Maps link.
Click once on that, then on Community Profiles, and you are brought to a fertile oasis of useful data about the city, broken into demographics, the economy and jobs, housing, transportation, and the environment and land use.
Have fun with it – and remember, SEMCOG is using all those numbers to help advocate for you, so give them a shout-out, why don’t you.
And, for goodness’ sake, slow the H (as in, Hamtramck) down!
Posted Dec. 3, 2021